Narrow band pass filter
This section introduces the 600 mm diameter narrow band pass filter we manufactured for the HSC (Hyper Suprime-Cam) at Subaru Observatory. (Fig. 1) The HSC is a large CCD camera installed at the Subaru Observatory, which is located at the top of Mauna Kea in Hawaii. It was necessary to have a large band pass filter tailored to the aperture of the HSC and this was manufactured by our company. (Fig. 2 [1]) We realized ±0.3% variation in the center wavelength and less than 0.01% transmission characteristics for the bands to be stopped.
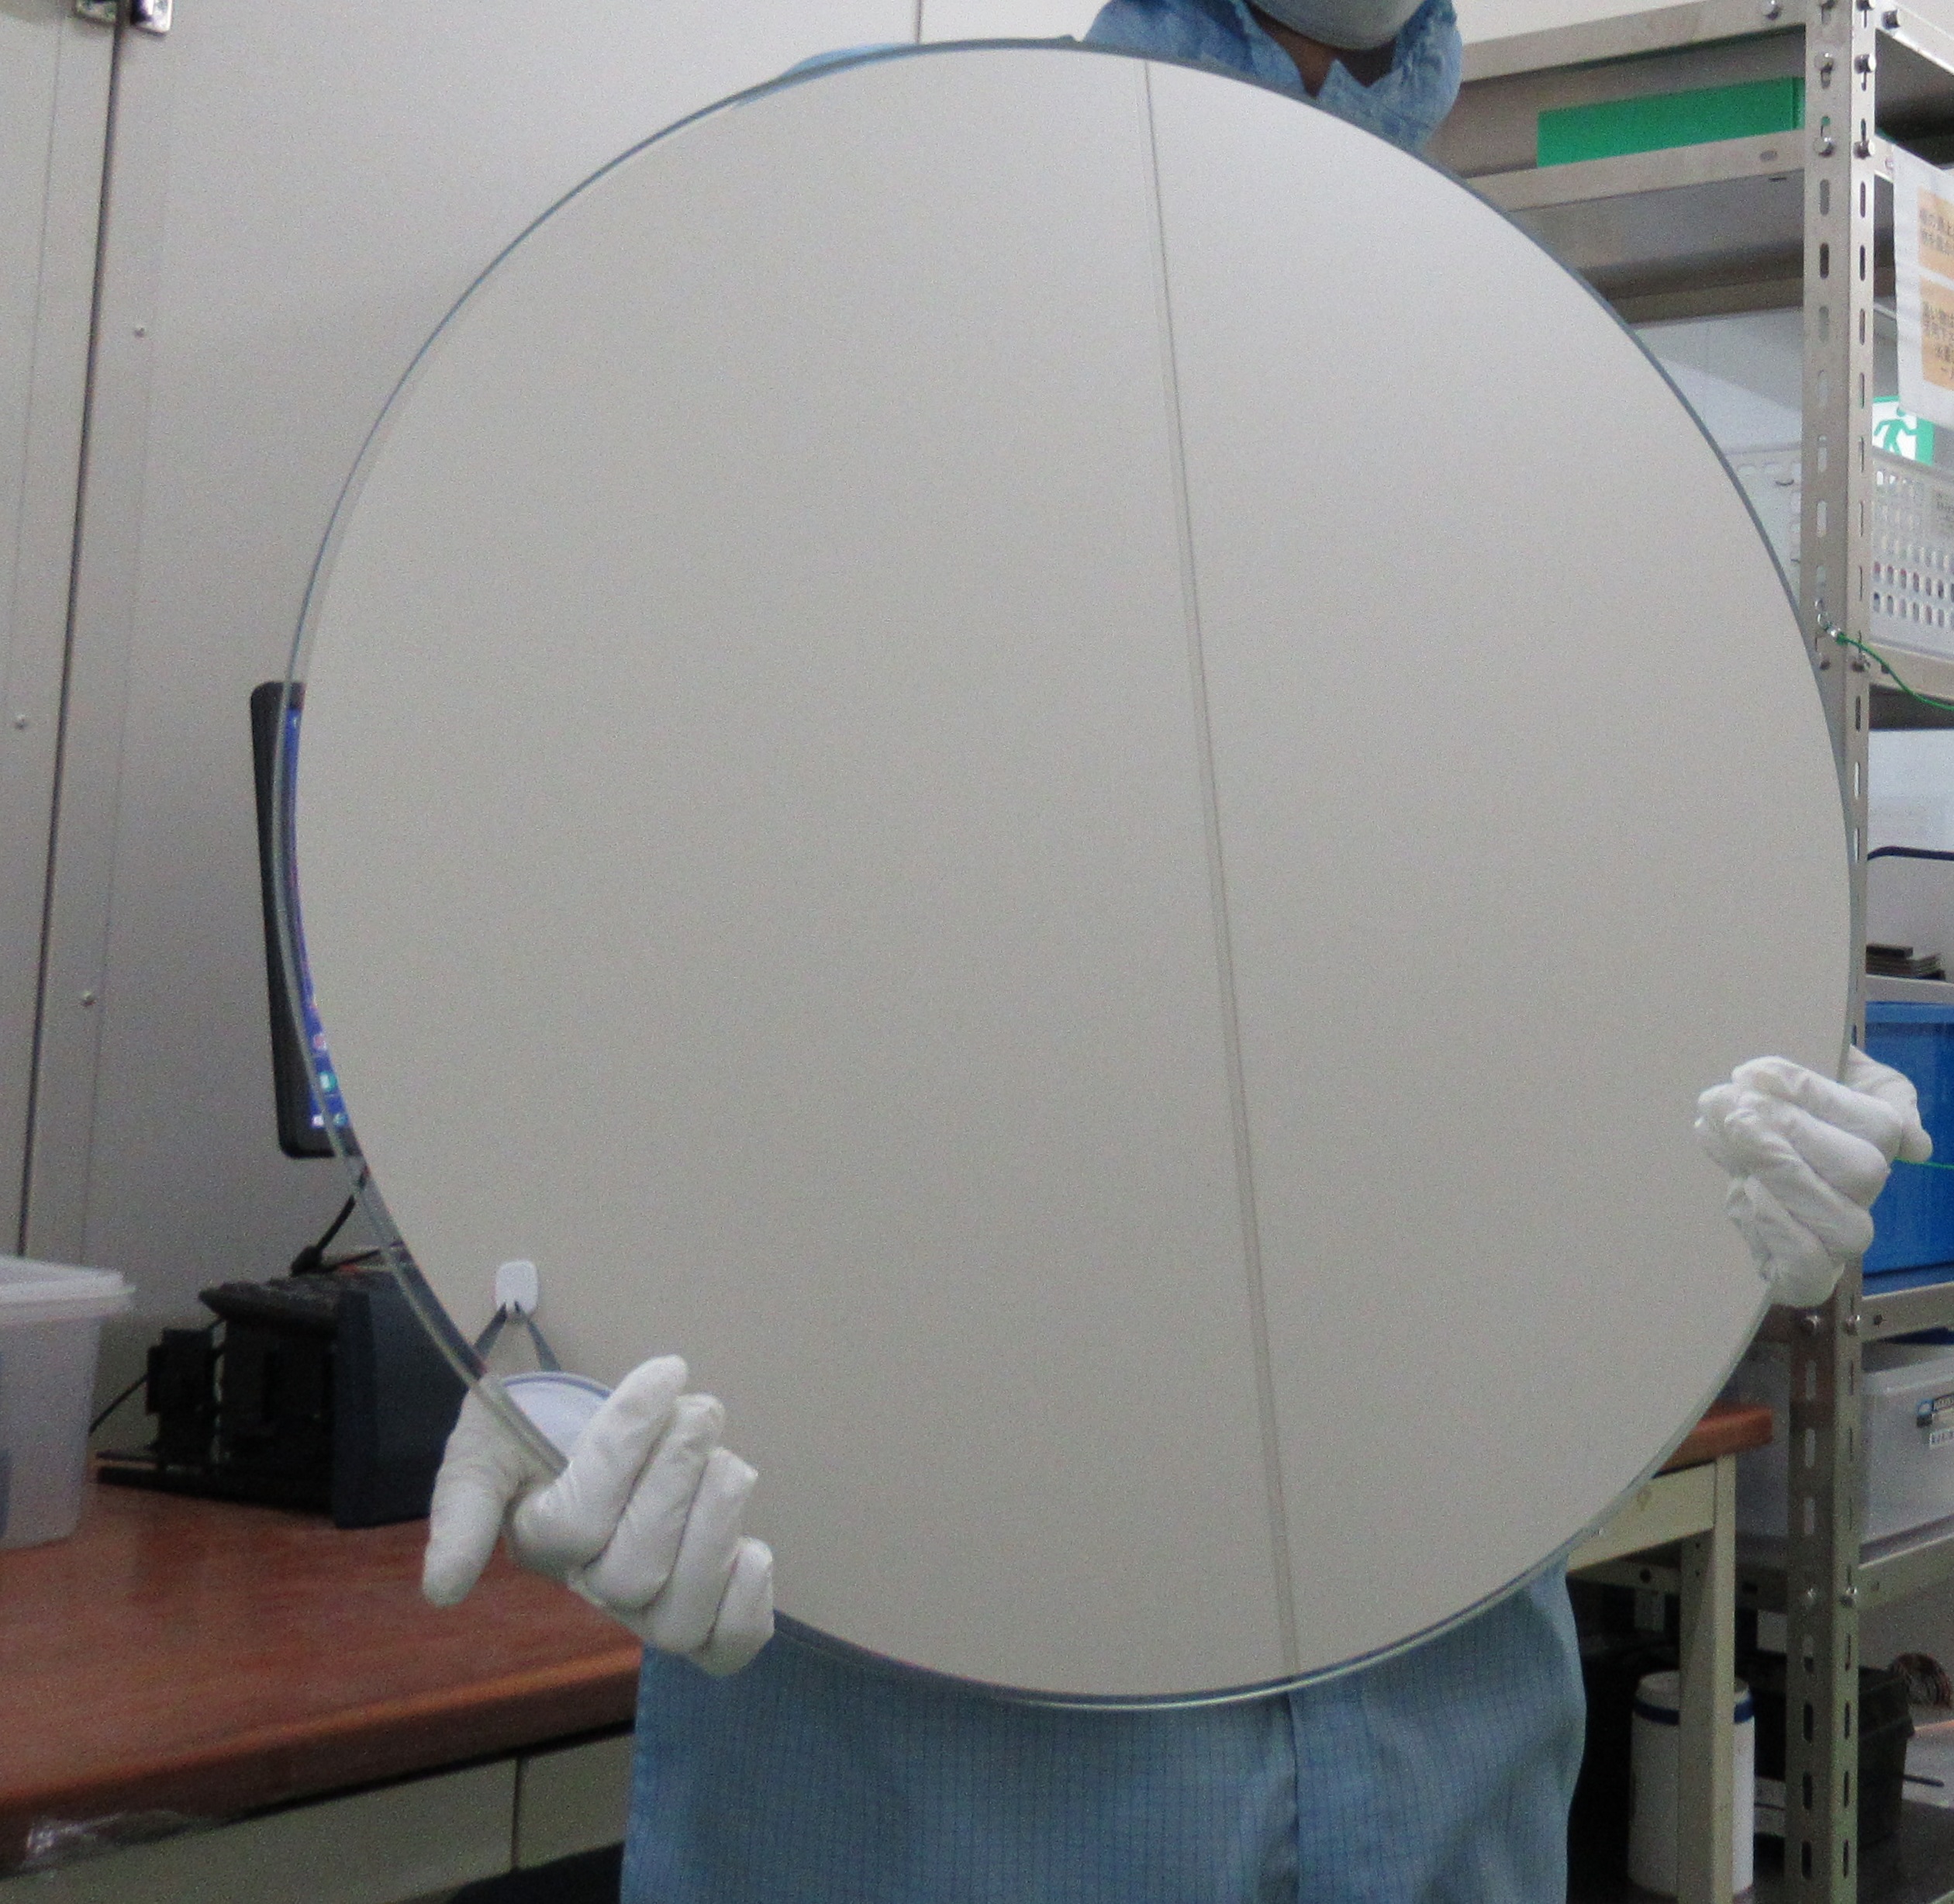
Fig. 1. 600 mm diameter narrow band pass filter

Fig. 2. Left: Overview of the Subaru Observatory, Upper right: Appearance of the HSC, Lower right: The filter and cover glass installed on the HSC [2] [3]
Characteristics
This is an introduction to the optical characteristics of the narrow band pass filter (NB387) with a center wavelength of 387 nm. (Figs. 2 to 3)


Fig. 3. NB387 measurement results Top: Whole-area OD measurement results, Bottom: Transmission band characteristic measurement results
The above figure shows the OD characteristics in the 300 to 1,100 nm wavelength region. An OD value of 4 or higher (transmittance less than 0.01%) has been achieved for the bands excluding the transmission band.
The lower figure shows the transmission band characteristics measured at multiple points across the 600 mm diameter of the substrate surface. It can be seen that uniform transmission band characteristics have been obtained.

Fig. 4. Left: Center wavelength distribution with respect to the NB387 substrate radius, Right: Transmittance band width
The figure on the left has the radius plotted on the horizontal axis and the center wavelength plotted on the vertical axis. It shows the uniformity of the center wavelength.
The figure on the right has the radius plotted on the horizontal axis and the transmittance band widths for each of 80%, 50%, and 10% plotted on the vertical axis. It shows the uniformity of the shape of the transmission bands.
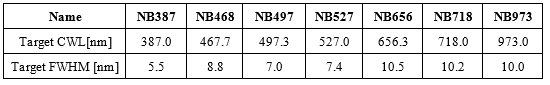
Table. 1. Past results for our narrow band pass filters
We have a track record of working with many universities and research institutes.
We can provide support with unique products that respond to the individual requests of the customers.
References